Platform: Analysis & Reporting
Use Data to Drive Decisions
Efficiently turn sensory and consumer data into actionable insights. Compusense handles the statistical complexity so you can focus on interpretation, decision-making, and communicating results effectively. Design and deploy high-quality sensory and consumer research studies to collect meaningful data with confidence. Whether studies take place in a controlled lab, in the home, or across distributed locations, Compusense maintains consistent methodologies and delivers clean, reliable results.
Statistical Analysis Built In
Discrimination Tests
Access automated analysis for Triangle, Tetrad, Duo-Trio, and Paired Comparison tests. Get immediate significance results based on standard statistical tables.
ANOVA & Post-Hoc Tests
Choose from multiple ANOVA models and post-hoc comparison methods to identify significant differences between products. Select the statistical approach that fits your study design—Fisher’s LSD, Tukey, Dunnett, or other standard post-hoc tests.
Consumer Data Analysis
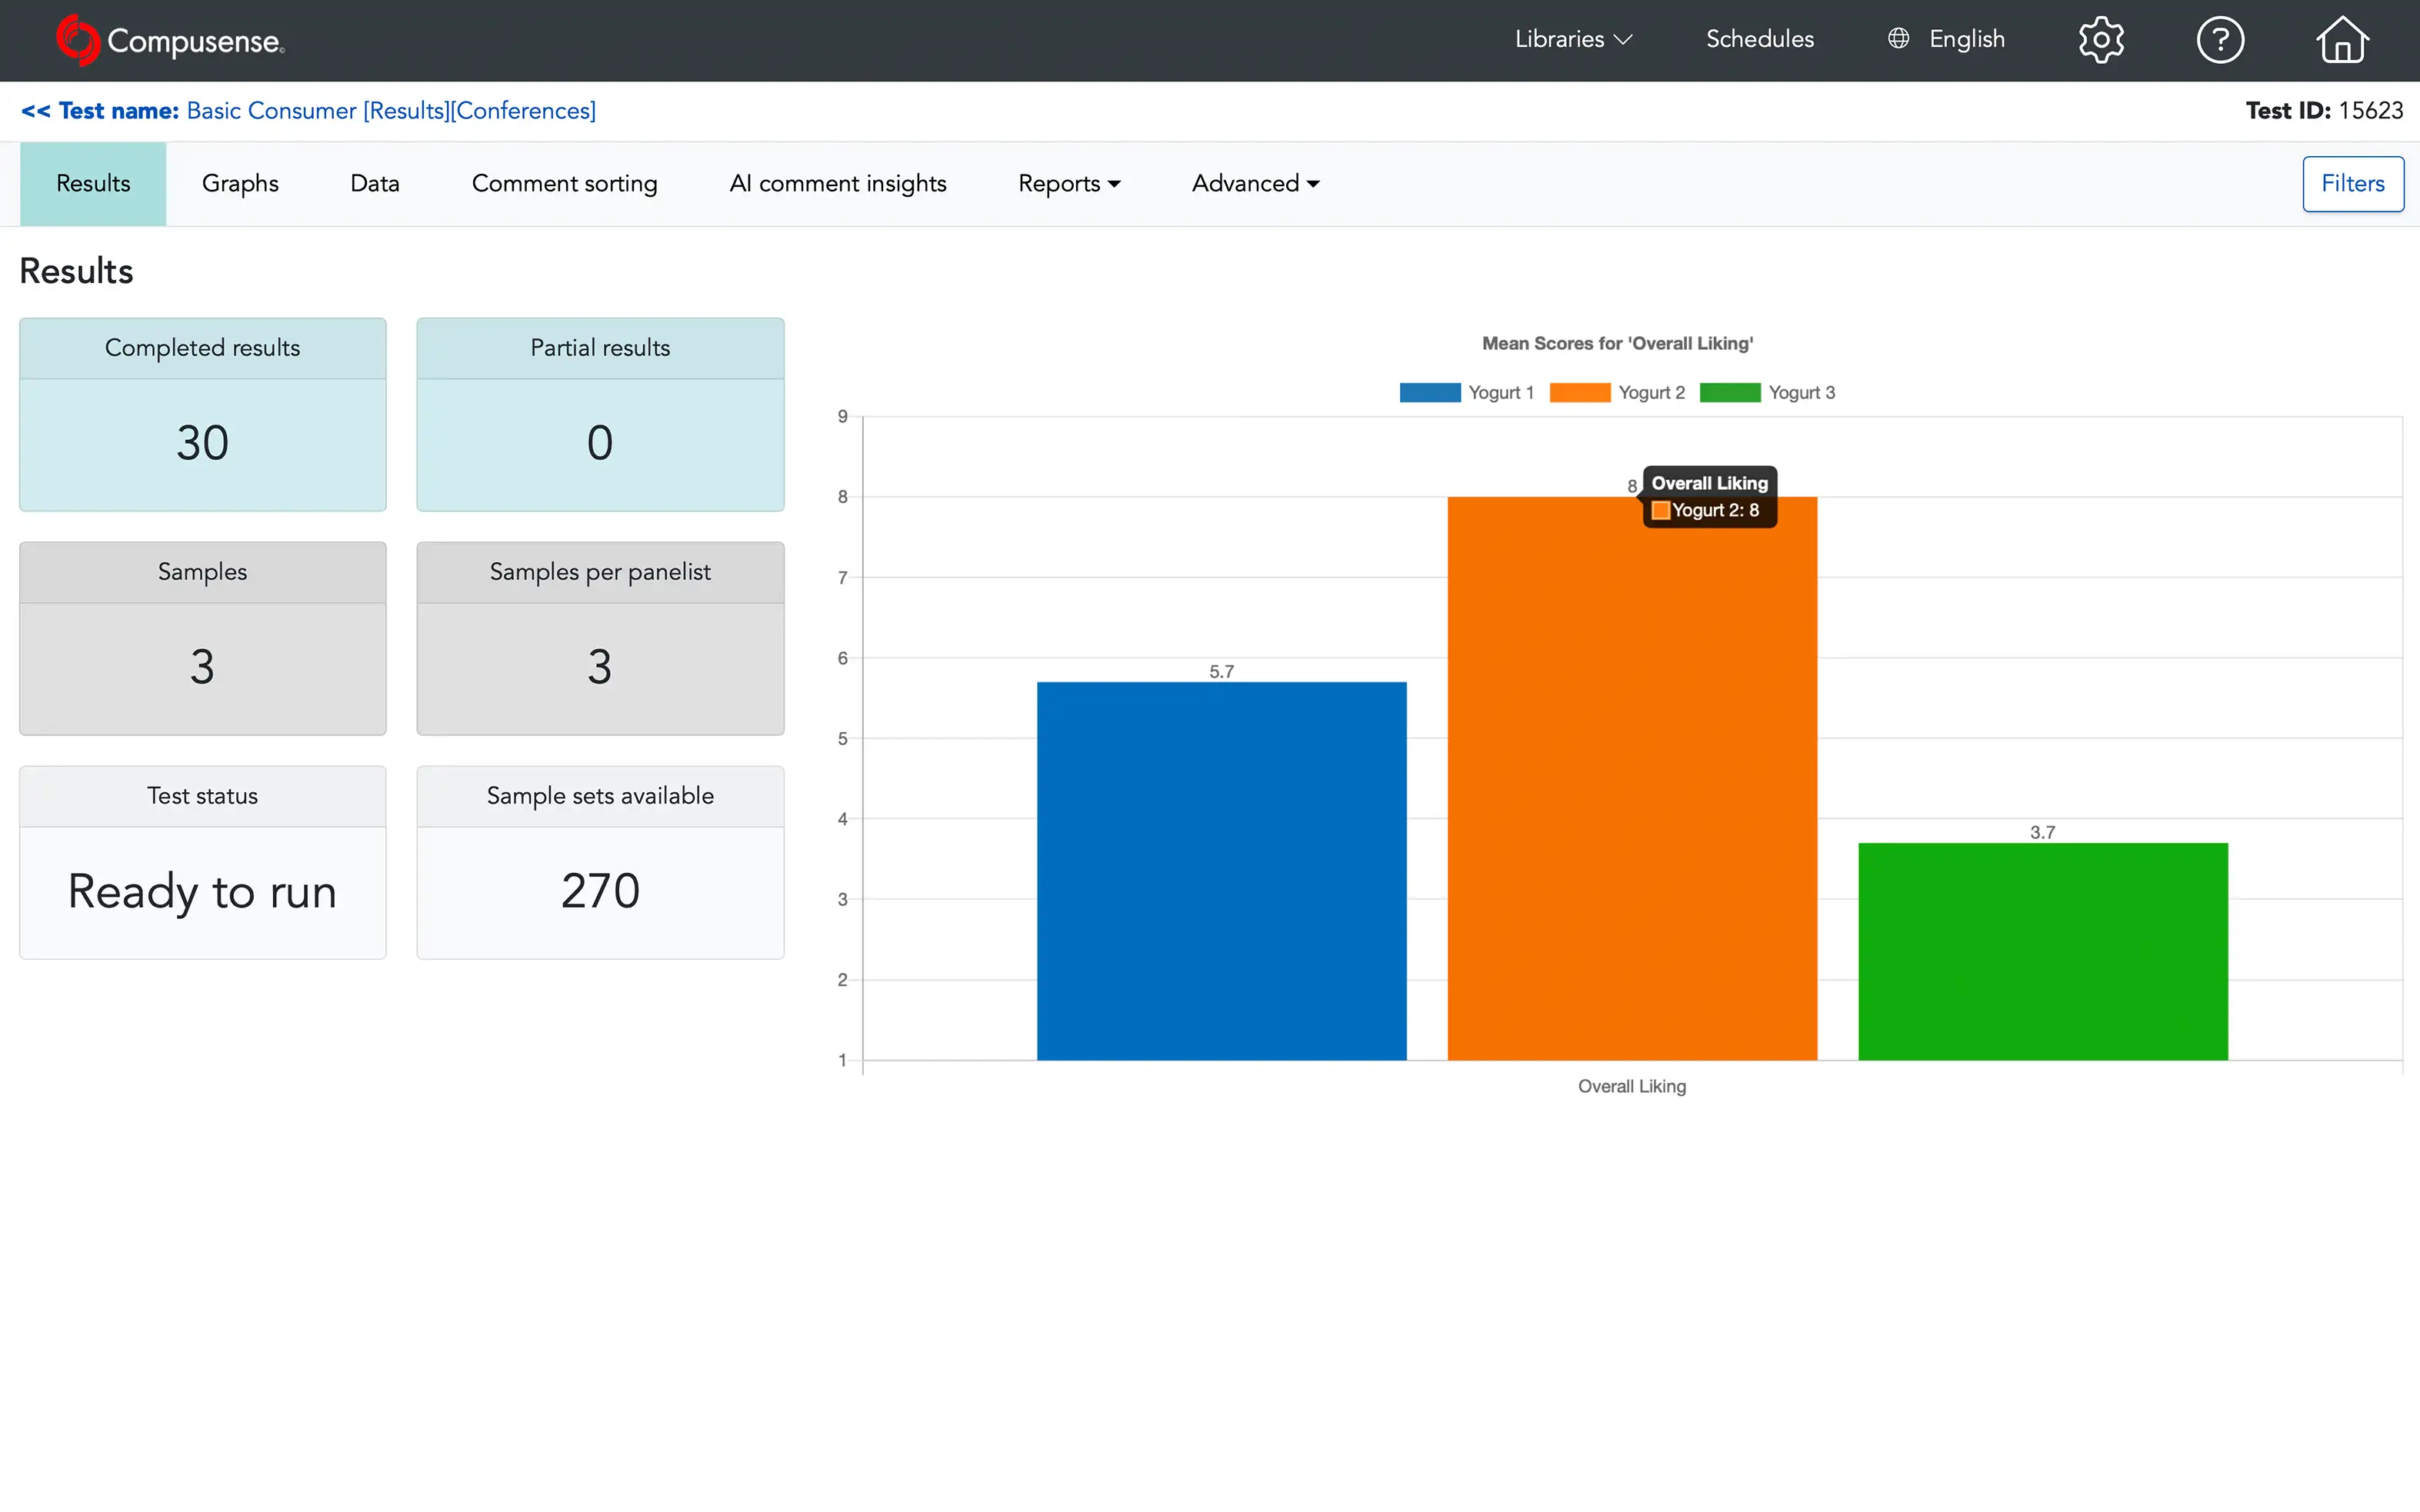
Analyze acceptance, preference, and purchase intent data. Utilize built-in tools for mean comparisons, frequency distributions, and identifying significant differences in consumer responses.
Multivariate Analysis
Leverage Principal Component Analysis (PCA) and other multivariate techniques for understanding relationships between products, attributes, and consumer preferences.
Automated Report Generation
Generate publication-ready, shareable results in seconds. Export to PowerPoint, Word, or Excel with auto-created charts, tables, and summaries formatted for effective communication.
Automatically get:
- Statistical test results with significance indicators
- Mean scores and frequency tables
- Charts and graphs for visual interpretation
- Sample serving orders and study metadata
Reports provide a starting point for your presentation with professionally designed templates. Easily customize formatting and styles, and add context based on your specific objectives.
Data Visualization Tools
Communicate insights with clear, professional visualizations:
- Bar charts and line graphs for mean comparisons
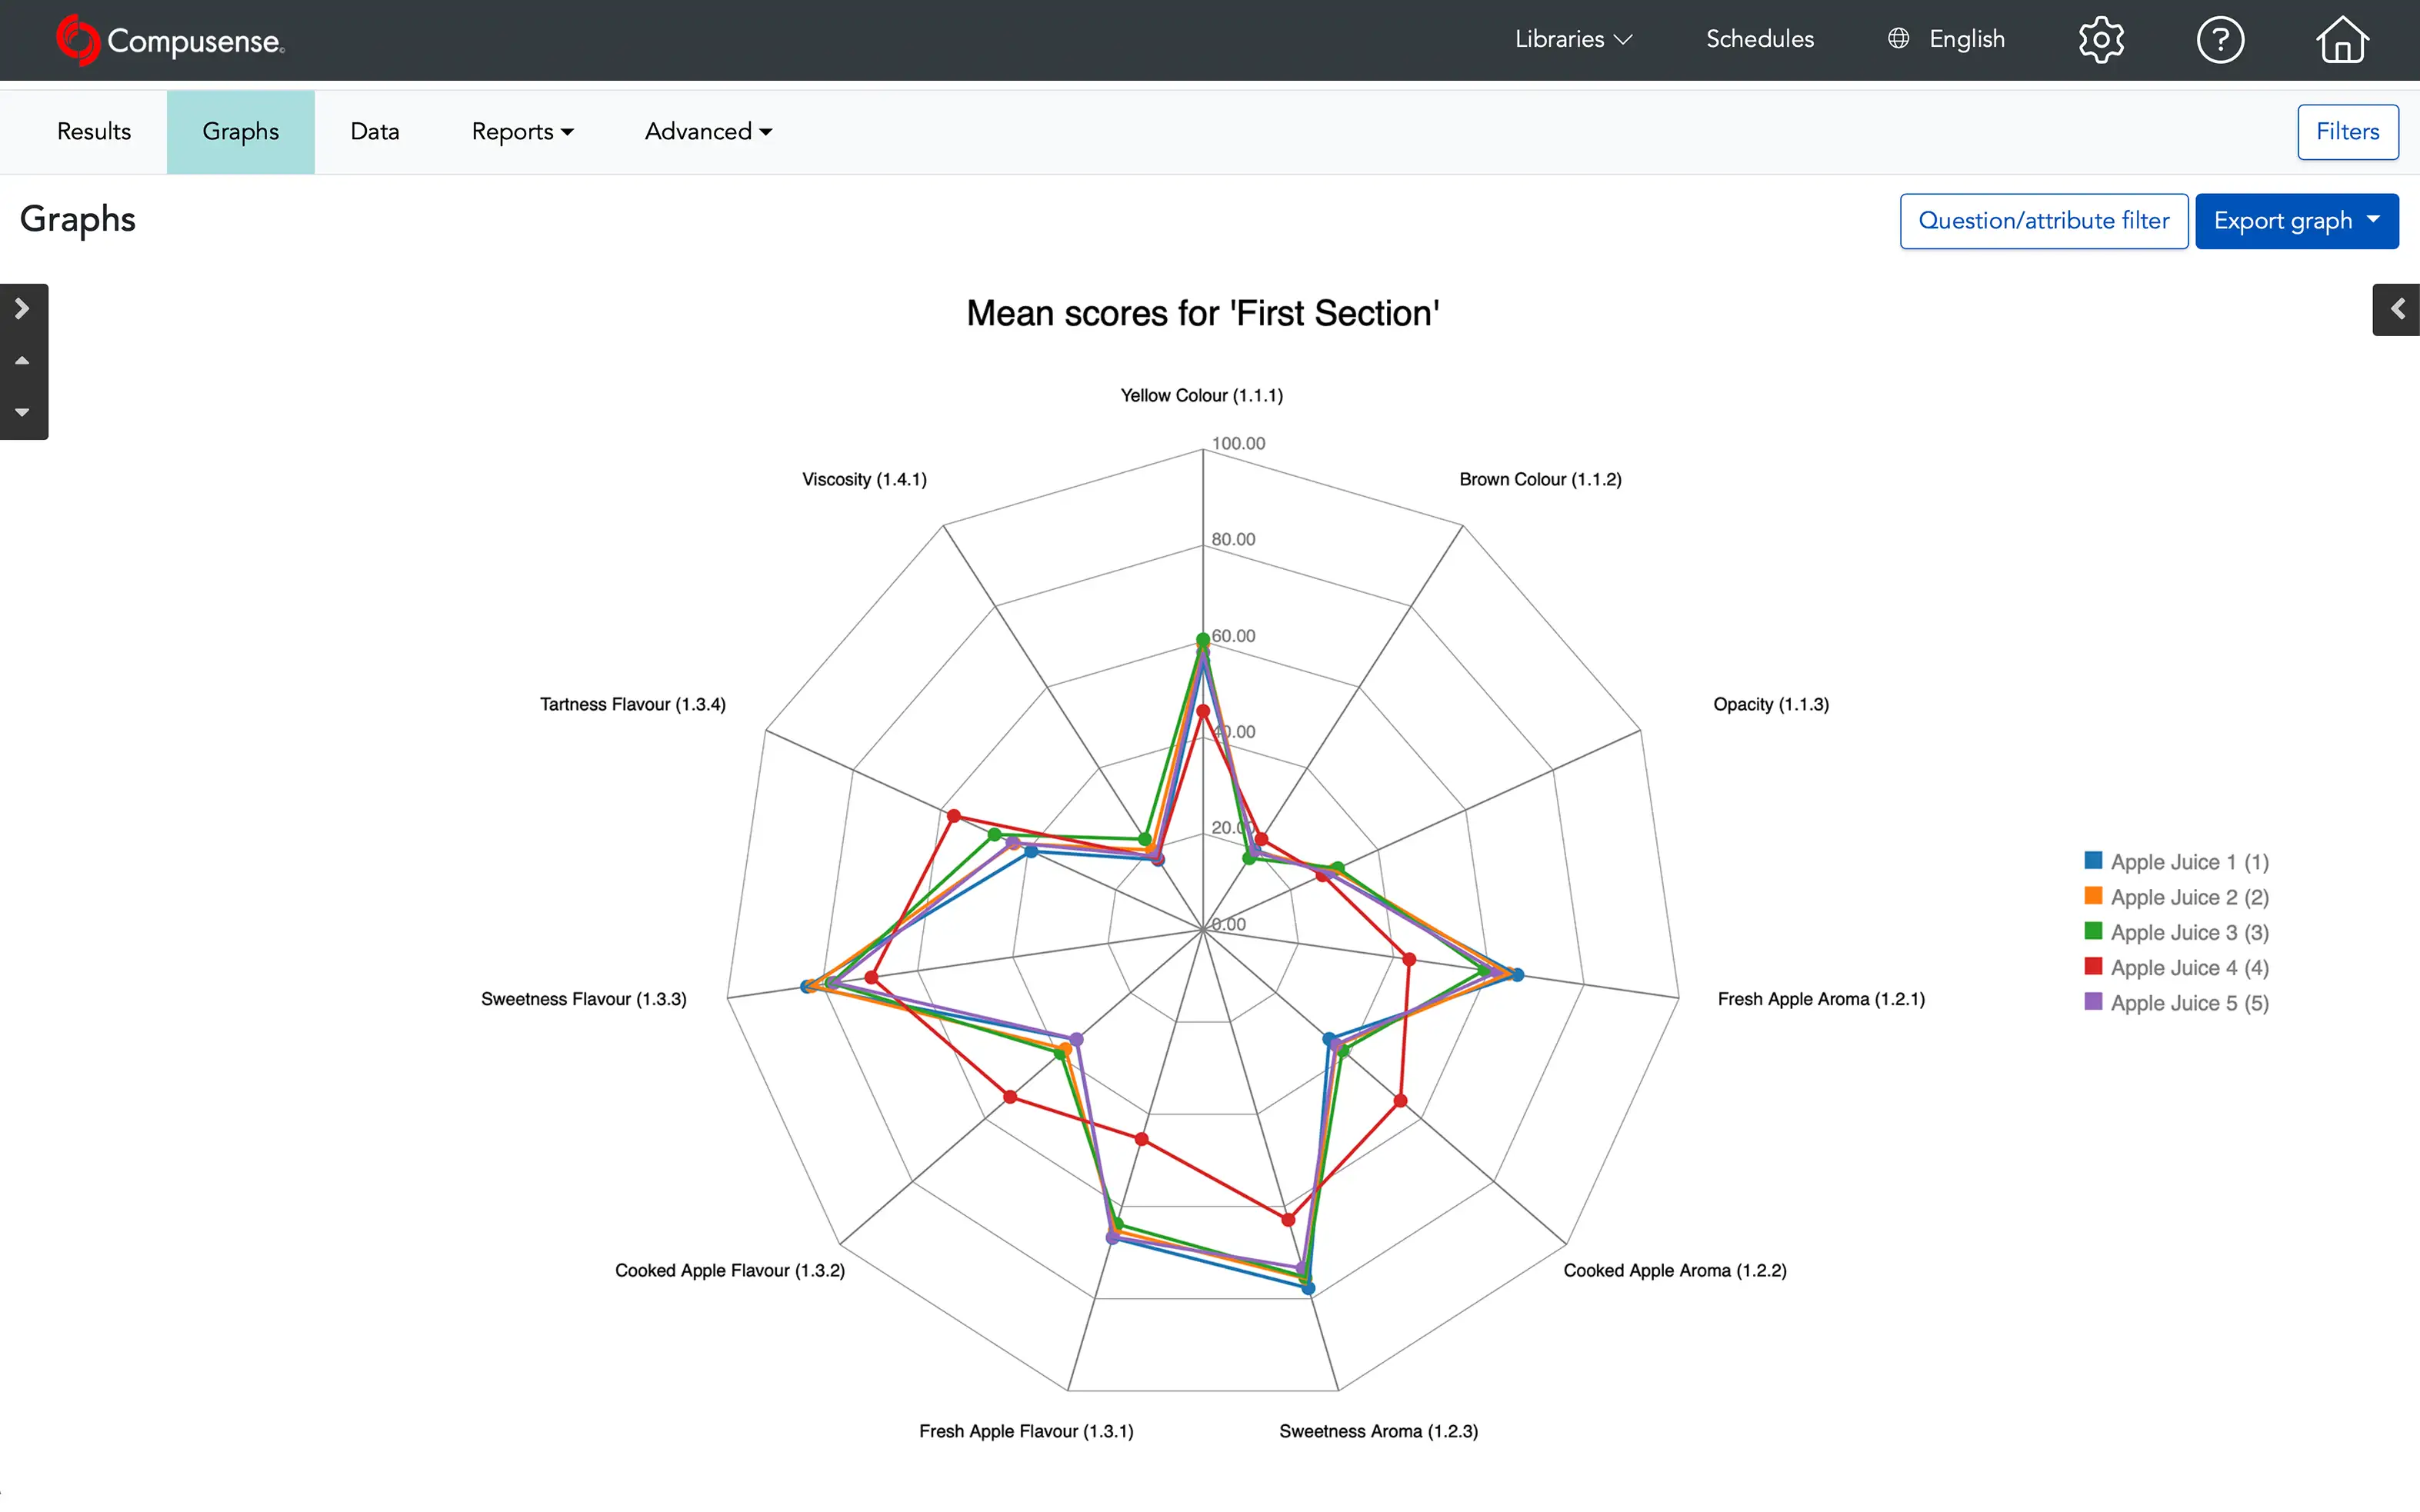
- Spider plots for product profiling
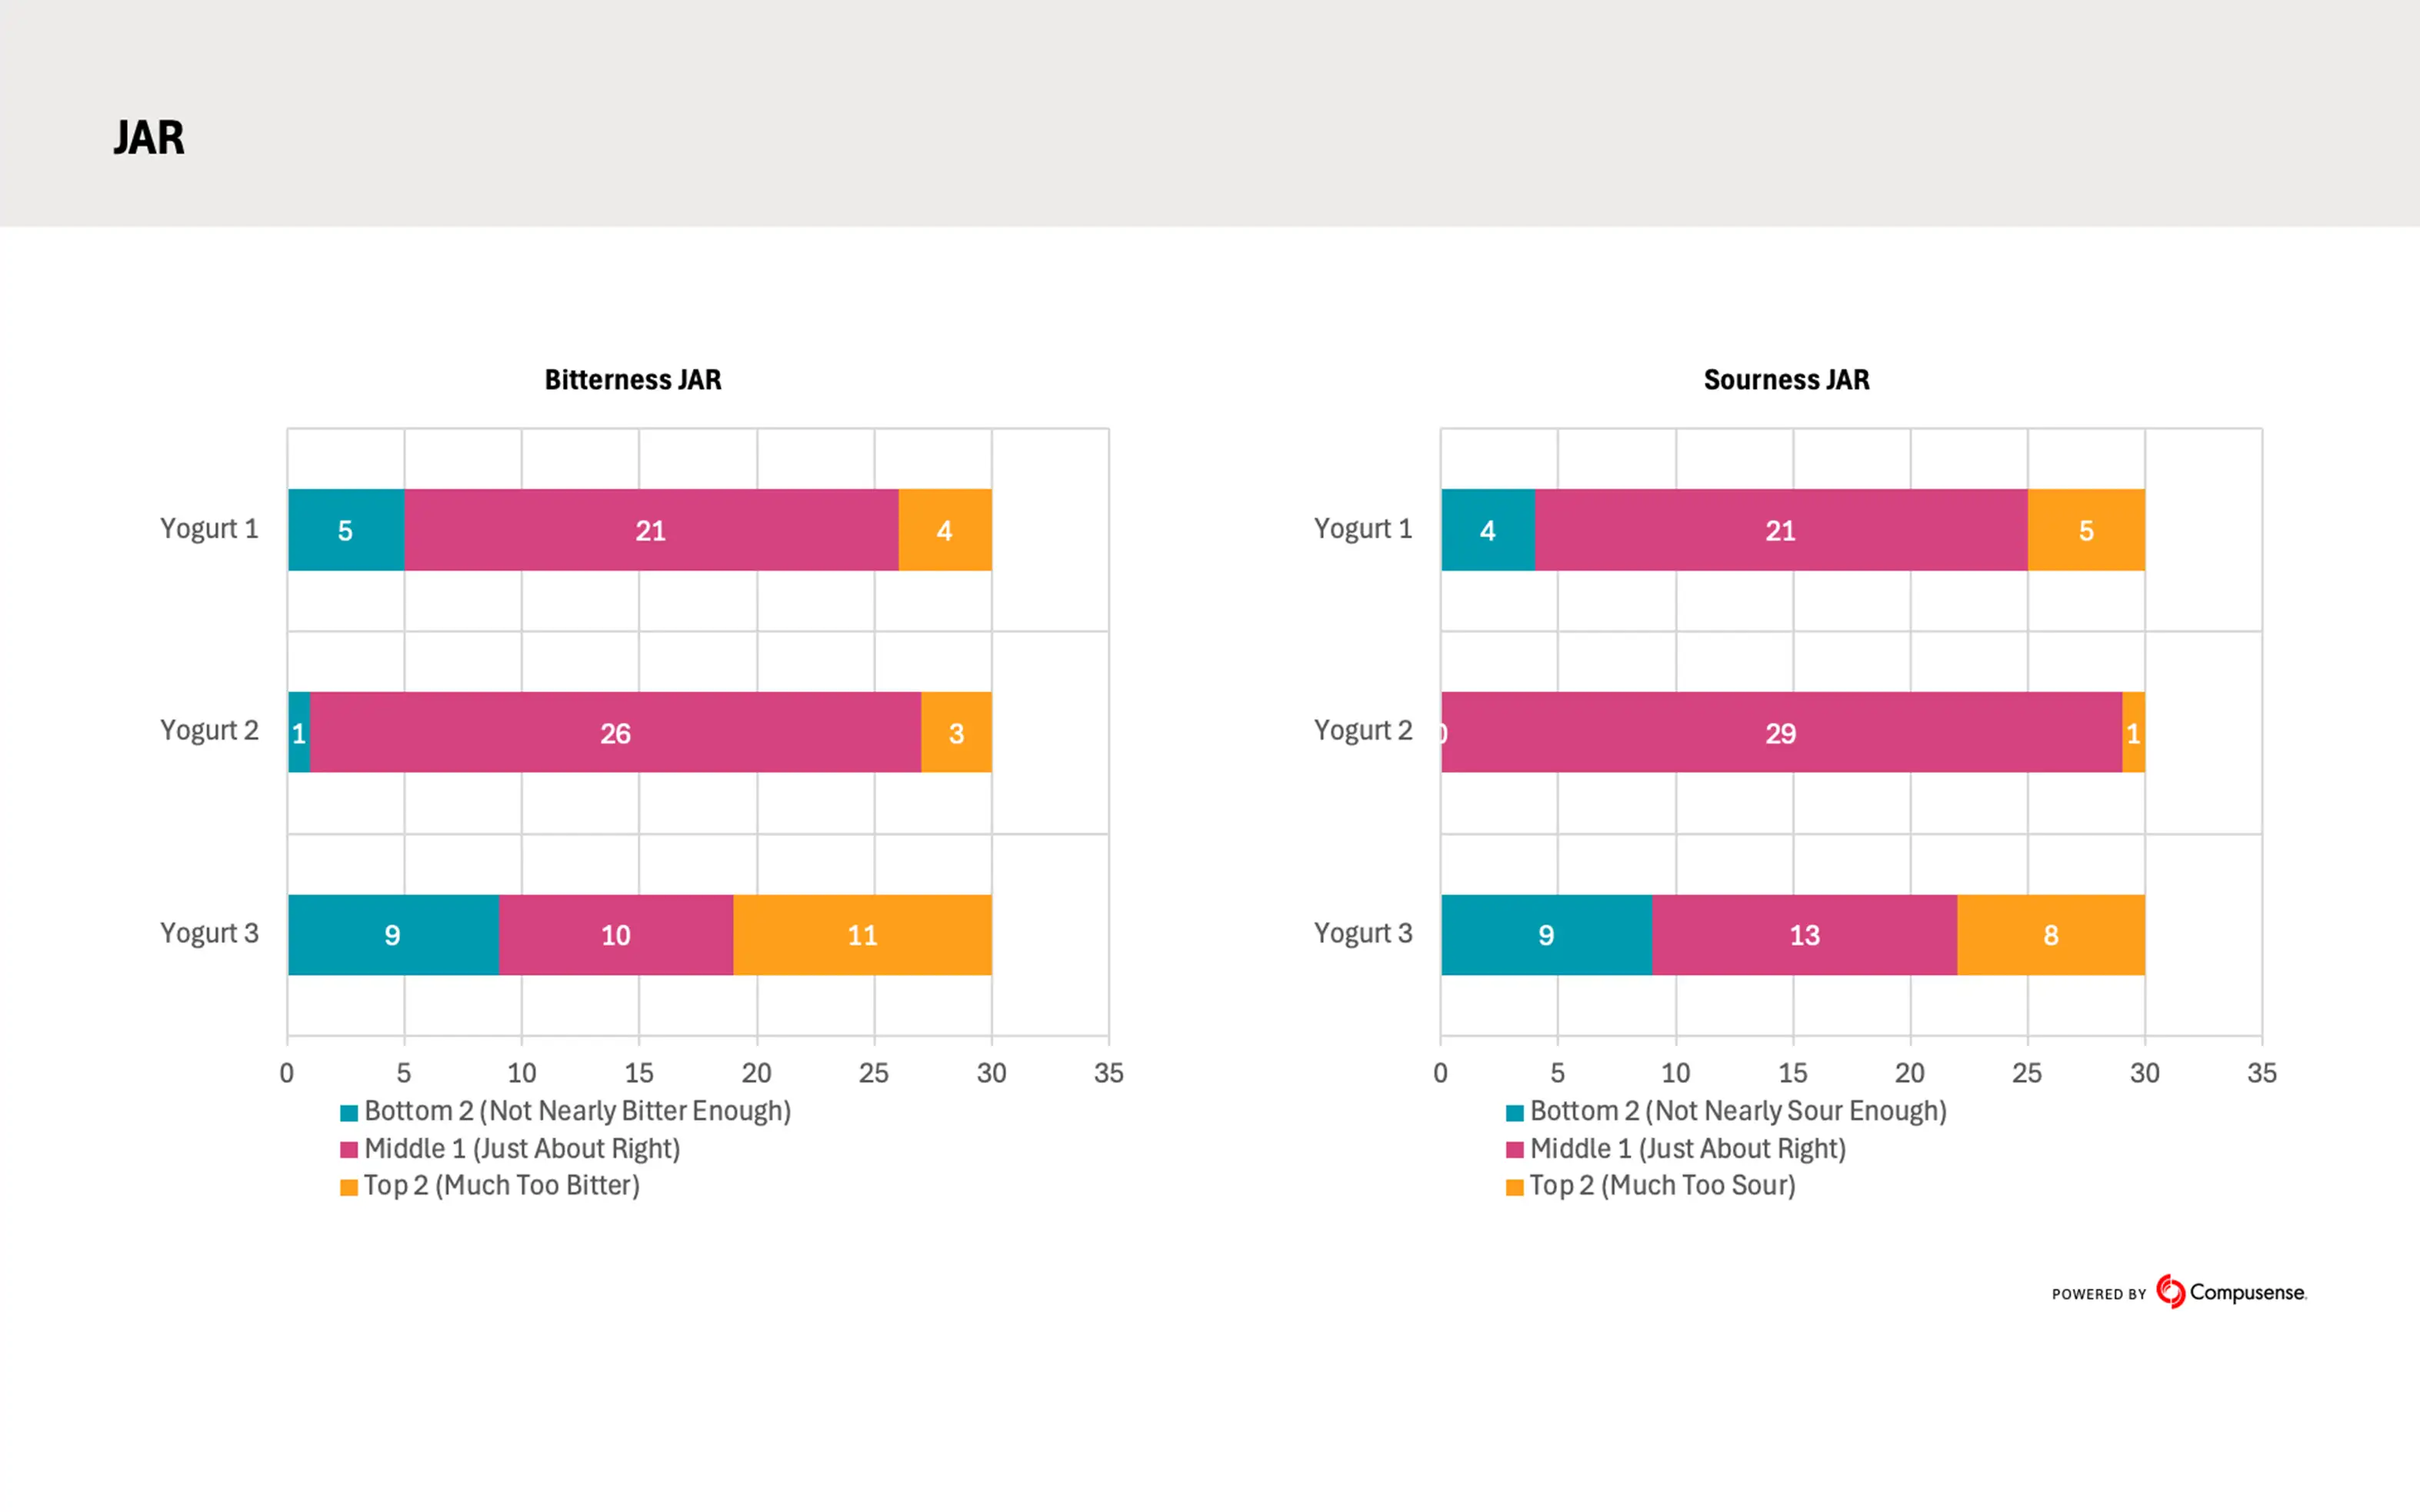
- Distribution charts for consumer data
- Temporal graphs for time-intensity studies
Export & Integrate Your Data
Download raw data and analysis results into Excel for further exploration, integration with external tools, or long-term archiving. Maintain complete control for advanced modeling or regulatory documentation.